Marketing and sales dashboards.
Reporting built around the decisions your team needs to make, with definitions everyone can follow.
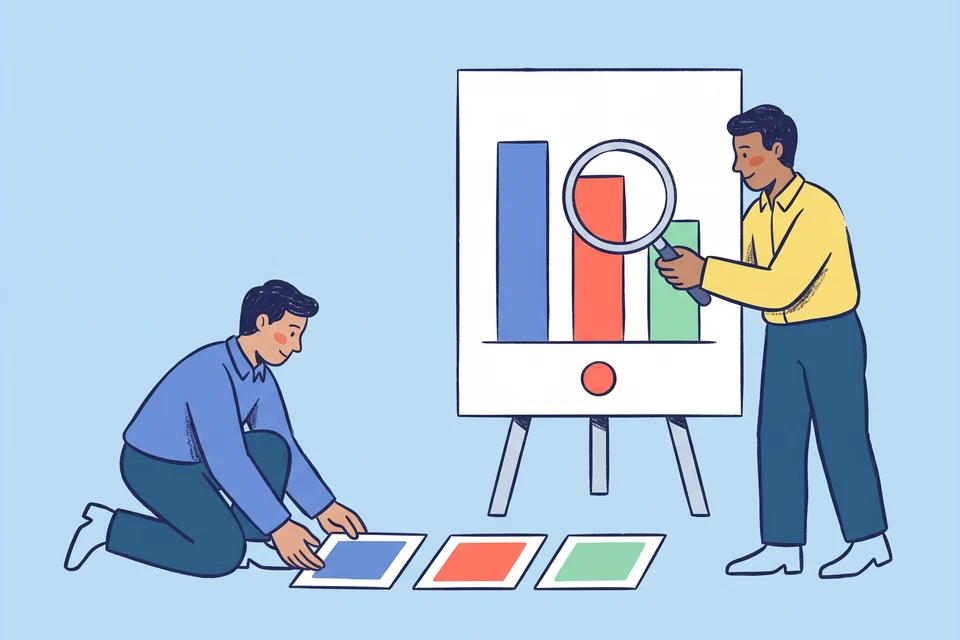
Choose the question before choosing the chart.
We organise reporting around the audience and the action it should support. A sales manager, marketer and business owner may need different views of the same data, with shared definitions underneath.
What we can build together.
The final deliverables, review rounds and schedule are agreed around your brief.
- Reporting requirements
- Define the users, decisions, metrics and reporting frequency.
- Data connections
- Connect agreed sources and document refresh schedules and access.
- Dashboard design
- Build readable views with comparisons, filters and context.
- Validation and handover
- Check totals against sources and explain how to interpret the report.
Design the report around a meeting.
Choose the decision the audience makes
Imagine the weekly discussion the dashboard should support. Which question should it answer, and what could the team do differently as a result? Remove metrics that add activity without helping that decision, or move them into a supporting view.
Make definitions and freshness easy to find
A number needs a time period, a definition and a known source. Show the refresh context and explain important exclusions. Validate the totals against the source systems before asking the team to rely on the report.
From brief to handover.
Define the decisions
Agree the questions each audience needs the dashboard to answer.
Build and reconcile
Connect data and compare the results with source systems before styling the report.
Put it into use
Review the dashboard with its users and document ownership and maintenance.
The answers to
your questions.
Get in touch
Can you combine marketing and sales data?
Yes, where the source systems and matching fields support the required view.
Will the dashboard update automatically?
That depends on the connectors and source refresh limits. We agree and display a suitable update schedule.
Can you improve an existing dashboard?
Yes. We can simplify the views, review definitions and correct data issues before adding new charts.